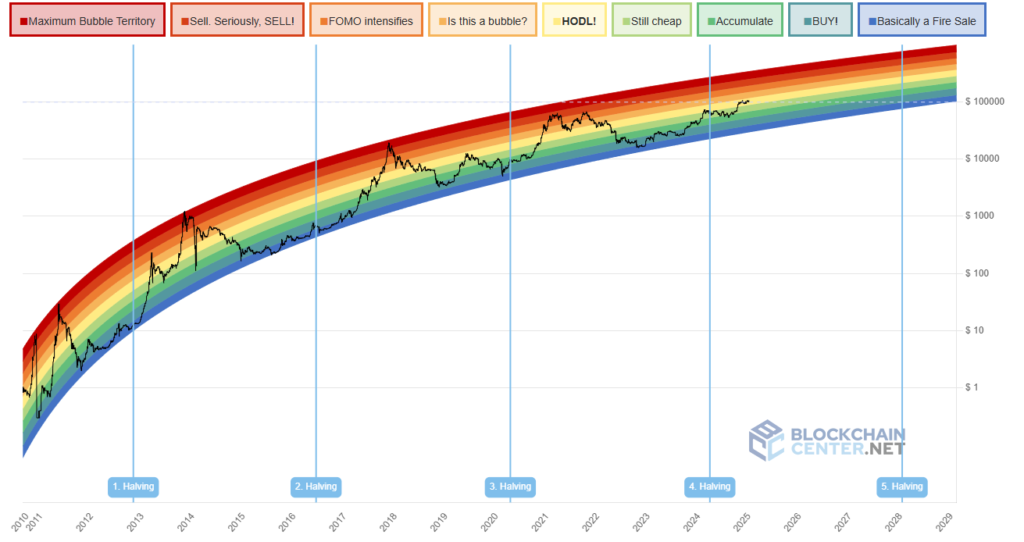
The rainbow chart is a colorful way to show how the price of an asset has changed over time, especially in the world of cryptocurrencies and finance. It uses a series of colors, just like a rainbow, to divide price ranges into different sections, each of which represents a specific sentiment in the market, a particular phase, or a level of risk.
Key Features of Rainbow Charts
- Color Sections:
The chart uses a mix of colors to indicate different price levels or valuation areas.
Each section reflects different market sentiments:
Red/Orange: This area represents a “danger zone” where prices are too high and may be in a bubble.
Yellow/Green: This is the neutral zone or where prices are considered reasonable.
Blue/Purple: Here, prices are low, which suggests a good opportunity for long-term investment.
- Logarithmic scale:
To better show rapid price changes, many rainbow charts use a logarithmic scale, which is especially useful in the unpredictable world of cryptocurrencies.
- Historical patterns:
The chart usually comes from past price data, which helps to identify repeated trends or cycles.
- General approach:
Rainbow charts are mostly based on patterns observed from history rather than strict mathematical rules. Their purpose is not to provide exact predictions, but rather a basic guide.

Image Credit : Blockchain Center
Cycles in rainbow charts
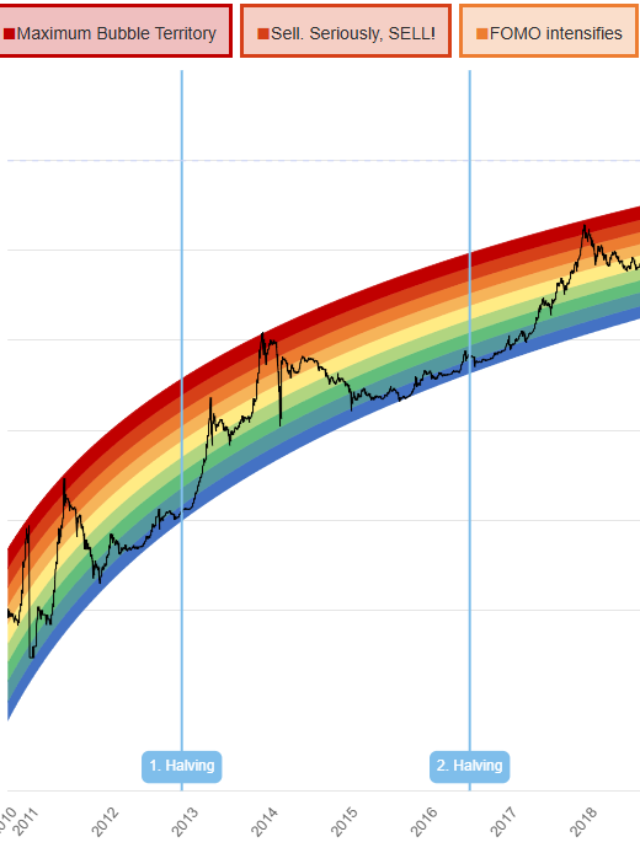
Rainbow chart cycles show how an asset’s price moves across its colored segments, often reflecting how investors think and act.
General phases of a cycle:
- Accumulation (blue/purple area):
Here, prices are low, and people are feeling negative. This is often seen as a great opportunity for long-term buyers.
- Initial growth (green area):
Prices begin to climb, causing the mood to turn from negative to cautiously positive. Smart investors begin to join the market.
- Bull Market (yellow to orange areas):
Prices rise as more people become interested and excited. This is the time when many retail investors jump in, causing prices to rise rapidly.
- Bubble Territory (red area):
High expectations and speculation push prices to unsustainable heights. At this point, the market can be overvalued and risky.
- Market Correction (back to blue/purple):
After the bubble bursts, prices fall rapidly, causing fear and panic that sends prices back to undervalued areas. Then, the cycle begins again.
Uses of Rainbow Charts
- Understanding market sentiment: This helps determine whether an asset is cheap, expensive, or priced right.
- Investment timing: It provides guidance on when to buy or sell based on past cycles.
- Trend recognition: It reveals long-term trends while filtering out temporary fluctuations.

Image Credit : Blackchain Center
Example: Bitcoin Rainbow Chart
A well-known rainbow chart is the Bitcoin Rainbow Chart, which categorizes Bitcoin’s historical prices into phases such as:
“Basically a fire sale” (cheap)
“Hodl!” (fair value)
“Sell. Seriously, sell!” (expensive or bubble territory)
These phases correspond to Bitcoin’s past price movements, highlighting its speculative nature and cycles of volatility.
A “rainbow chart” is a visual tool that displays Bitcoin’s price history over time, using a colorful gradient. It presents various price levels in a spectrum of colors, which helps to highlight possible upward or downward trends, allowing users to observe past patterns in the market.
You can access these charts on different financial websites that monitor Bitcoin’s price, such as TradingView or Glassnode. They aim to give a clearer picture of Bitcoin’s price movements over the long term.
Is Cardano Set to Explode by 2030? Expert Price Predictions and Insights


One thought on “Bitcoin’s Rainbow Chart: A Tool for Predicting the Next Bull Run”